
The group stage of any international tournament or continental club competition is a pressure cooker where small margins decide who advances. Metrics give us a way to separate noise from signal: instead of reacting to a single result, we can inspect the mechanics beneath goals and standings. This article walks through the practical analytics you can use to read a group table intelligently, and shows how those numbers translate into probabilities and tactics.
Why the group stage deserves its own analytical lens
Group play is uniquely volatile. Teams often rotate, ramp up or down intensity depending on schedule, and face opponents with wildly different styles, so the usual season-long benchmarks lose some relevance. That variability makes raw points a blunt instrument; underlying metrics provide context that helps explain whether a win was deserved or a lucky escape.
Small sample size is the persistent statistical problem in four- or three-game pools. A single fluke goal, an early injury, or a penalty can swing a tie-breaker and produce misleading headlines. Understanding uncertainty—confidence intervals, variance, and expected values—lets you avoid the temptation to overreact to a single match.
Essential metrics to follow in the group stage
Not every metric carries equal weight in a short tournament. Focus on a core set that captures creation, prevention, and structural tendencies: expected goals (xG) and expected goals against (xGA), shot volume and quality, progressive carries and passes, pressing intensity (like PPDA), and set-piece involvement. Together these form a concise fingerprint of performance.
Below is a compact table that maps each metric to what it typically signals and how to use it during a group stage. Keep it lightweight—analytics is about clarity, not number overload.
| Metric | What it measures | How to use it |
|---|---|---|
| xG / xGA | Quality of chances created and conceded | Estimate fair scoring; flag regression |
| Shot volume & shot locations | Quantity and danger of attempts | Distinguish high-press vs low-block teams |
| PPDA / pressing metrics | Opponent time on the ball per defensive action | Gauge pressing intent and stamina cost |
| Progressive passes/carries | Advancement into attack | Assess creativity and route to goal |
Expected goals (xG): the backbone of tournament reading
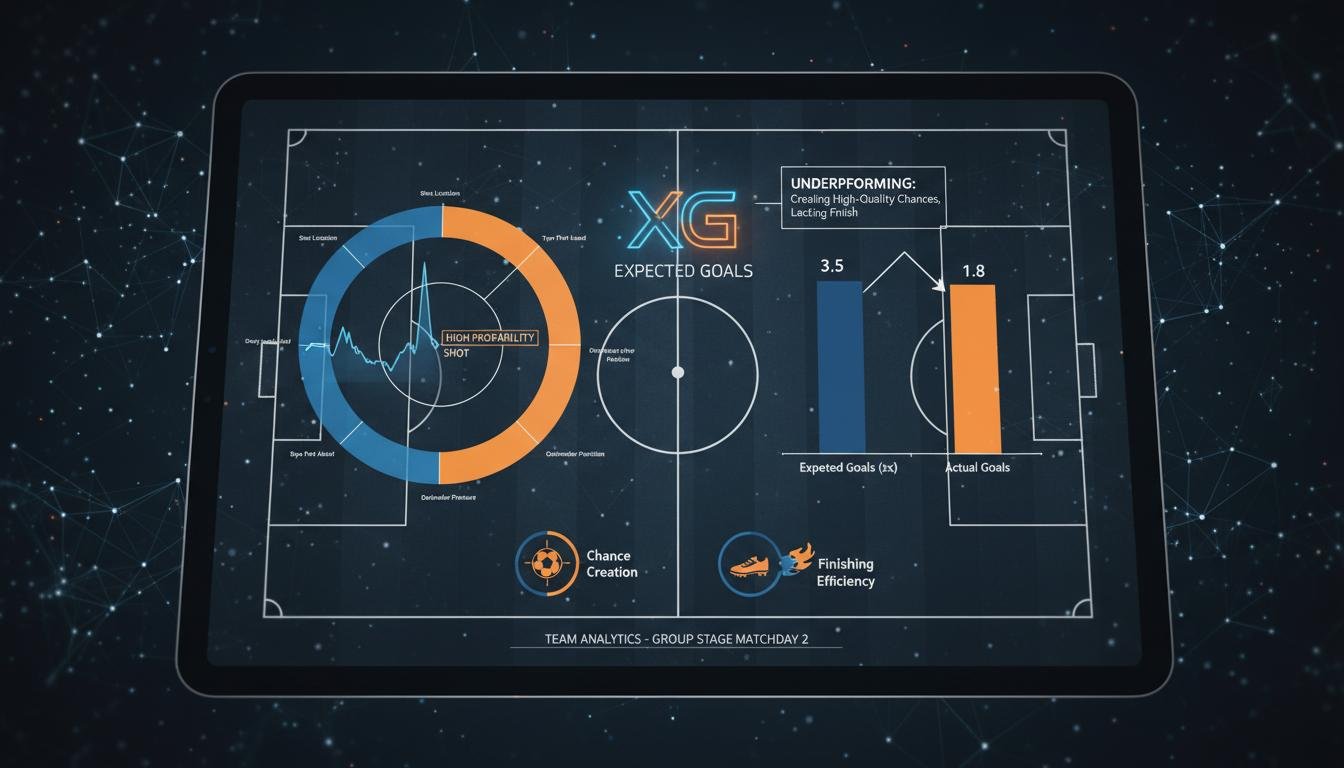
xG models assign a probability to every shot based on location, type, assist, and other features; summed over a match, xG tells you whether a team created genuinely dangerous chances. In group play, comparing actual goals to xG reveals who is over- or under-performing and who’s likely to regress toward an underlying mean.
For example, a defensively solid team that registers two 0-0 draws but has xG figures of 0.9 and 1.1 for the opponents may actually be more vulnerable than the scoreline suggests. Tournament coaches read these gaps as red flags, and analysts will flag match-ups where xG indicates likely correction.
Shot quality, shot volume, and the difference between luck and process
Volume matters—more shots generally increase scoring probability—but location and buildup matter more. A team that generates lots of low-value perimeter shots without entries into the penalty area has a different profile than a side that creates fewer, but highly dangerous, shots. Zones and expected shot value (xG per shot) should influence whether a team’s attack is sustainable.
In practice, watch for teams that combine high progressive passes with entries into the box; they tend to convert better over multiple games. Conversely, a team relying on long-range finishes can streak in a group stage but is unlikely to sustain that over four matches against varied defenses.
Possession, progression, and the emergence of modern attack metrics
Raw possession percentages are a blunt measure. More useful are progressive passes and carries, sequences into the final third, and passes into the penalty box. These metrics tell you whether a side is actually building chances or merely circulating the ball without threat. In group play the distinction is crucial for forecasting future outcomes.
Expected assists (xA) and shot-creating actions (SCA) identify the players and types of plays that produce danger. If an underdog is generating high progressive carries or SCA, they may be primed for an upset even if possession or points currently lie elsewhere.
Pressing and defensive structure: PPDA, pressures, and transitions
Pressing metrics like PPDA (passes allowed per defensive action) quantify how willingly a team engages opponents high up the pitch. A low PPDA usually signals aggressive pressing, which can yield turnovers and scoring chances but also leaves space behind the press—a tactical trade-off that matters in short tournaments when rotation affects legs.
Transitions are equally important. Metrics for counter-attacks, quick break opportunities, and successful recoveries show how well a squad converts turnovers into shots. Teams built on transition football can punch above their xG in a single match, making them dangerous but also somewhat inconsistent across a group.
Translating metrics into probabilities and expected points
To turn match-level metrics into group forecasts you need a model that maps xG and defensive data to goal probabilities, and then simulates the remaining matches. The simplest approach is to convert expected goals into Poisson distributions and simulate thousands of iterations to estimate progression probabilities, expected points, and likely tie-breaker scenarios.
More sophisticated methods incorporate Elo ratings, SPI (Soccer Power Index), or Bayesian updating to account for small samples and prior knowledge. These frameworks give you uncertainty ranges—critical in tournaments where one match can flip a group’s ordering—and help avoid misleading determinism about who “should” qualify.
Monte Carlo simulations and handling small samples
Monte Carlo simulations assign probabilistic outcomes to future matches based on current metrics and repeat the tournament many times. The result is a distribution of possible tables, not a single deterministic ladder. This distribution highlights how likely each team is to advance, while presenting the uncertainty inherent in short competitions.
When building simulations, incorporate variance from unit-level events (e.g., penalty calls, red cards) and adjust for lineup uncertainty. Group-stage rotations are common; a heavily rotated lineup should enter the model with lower expected parameters and higher variance than the season baseline.
Tie-breakers, goal difference, and the incentive structure
Different competitions apply different tie-breakers—head-to-head, goal difference, goals scored—so analytic priorities change accordingly. In tournaments where goal difference is decisive, attacking metrics and shot volumes gain importance; in head-to-head systems, comparative xG in direct matchups matters more than global goal tallies.
Coaches alter behavior based on these rules. If goal difference is king, a team trailing late in the group could chase goals aggressively, shifting expected goals and increasing variance. Analysts must model these strategic incentives so probability projections reflect realistic tactical choices.
Reading the table beyond points: trends, fatigue, and rotation
Points are the headline, but trend lines reveal momentum. Track moving averages of xG and xGA, minutes played by core starters, and substitution patterns to infer whether performance is stable or fragile. Small injuries or accumulating yellow cards can meaningfully change a team’s profile over three to four matches.
Fatigue compounds across a short group stage. Metrics like distance covered, high-intensity sprints, and number of pressures provide a physiological signal that can predict late-stage declines. Clubs with deep benches manage load better, and that depth can be quantified and fed into simulations.
Squad composition and the analytics of depth
Depth isn’t just quantity; it’s the positional and stylistic compatibility of substitutes. Metrics that track replacement players’ progressive passes, successful dribbles, and defensive actions help estimate how much a coach can rotate without degrading expected performance. In groups packed with matches, a balanced depth profile becomes a competitive advantage.
When I worked on short tournament scouting for a regional youth championship, projecting how rotation would affect each team proved decisive. Teams with similar starting-line quality diverged in outcomes when one could change shape mid-tournament without sacrificing chance creation.
Practical workflow: how to analyze a group quickly and reliably
Start with a simple checklist: assemble shot-based metrics (xG, xGA, shot maps), progression indicators (progressive passes/carries, SCA), defensive pressures (PPDA), and set-piece data. Normalize these statistics by opponent strength and minutes played to handle rotation and schedule differences. Avoid overfitting by keeping the model parsimonious.
Next, run baseline simulations using Poisson or negative binomial distributions for goals based on xG/xGA, then augment with priors from Elo or SPI to reflect historical strength. Produce outputs that matter: probabilities to advance, expected points, most probable tie-breaker paths, and sensitivity analyses showing which single game outcomes swing the group most.
Communicating metrics to coaches and fans
Clarity is everything. Coaches want actionable insights: which players to rest, which tactical tweaks lower opponent xG, and how many goals are required to feel safe. Fans want narratives grounded in numbers: who’s overperforming, which matches are still decisive, and whether a draw is acceptable strategically. Visuals—density plots, cumulative xG timelines, and scenario tables—bridge the gap.
When presenting to non-technical audiences, avoid jargon. Translate a 0.6 xG advantage into a simple statement: “That team created chances worth roughly 0.6 goals more than its opponent, implying a clear attacking edge.” Contextualize with probabilities rather than absolutes.
Common analytical pitfalls in short tournaments and how to avoid them
First, don’t treat single-match metrics as definitive. Outliers are common in group play; use shrinking techniques or Bayesian priors to pull extreme single-game values slightly toward a season baseline. Second, don’t ignore tactical context: a low xG might be deliberate if a team is choosing to counter-attack and absorb pressure.
Third, watch lineup noise. A top player’s absence can dramatically alter expected outputs; always consult pre-match lineups and adjust metrics accordingly. Finally, avoid overfitting: fewer parameters and robust cross-validation on past tournaments often yield better predictive performance in short competitions.
Watching matches differently: what metrics tell you to focus on live
If you follow metrics live, they sharpen what to watch. When seeing a team with high PPDA but low xG, expect pressing without clinical chance conversion—look for second-ball recovery and finishing. When a side shows high progressive passing but low shots, watch how often crosses and final-third entries translate into penalty-area involvement.
Also, pay attention to set-piece indicators. In group play, a team with few open-play chances but solid set-piece conversion can outperform expectations. Analysts track set-piece xG and set-piece goals to identify teams that might be undervalued by open-play metrics alone.
Tools, data sources, and people worth following
For open data and public models, FBref (StatsBomb data), Understat (xG-based shot maps), and FiveThirtyEight’s SPI are excellent starting points. Opta and StatsBomb provide richer event-level data for paid clients and are the backbone of professional match analysis. For tutorial content and methodological clarity, Michael Caley, Ted Knutson, and the team at StatsBomb publish valuable pieces.
Books and academic work are helpful too. Chris Anderson and David Sally’s The Numbers Game offers historical perspective and foundational thinking about soccer metrics, while FiveThirtyEight’s methods pages explain Elo and SPI in tournament contexts. Follow these sources to deepen both conceptual and practical skills.
Case study: interpreting a tight group after two rounds
Imagine a four-team group with two rounds complete: Team A has 4 points (2-2 xG), Team B has 4 points (1-0 xG), Team C has 3 points (2.8 xG), and Team D has 0 points (0.6 xG). Surface reading puts Teams A and B ahead, but xG suggests Team B has been unlucky to only score one goal from a single high-quality chance, while Team C has created more but turned draws into a costly loss.
Simulating the final round with updated xG inputs shows Team B’s progression probability rises if they can maintain creation, while Team A’s better defensive profile matters in a direct matchup. The scenario highlights how xG and match-up specifics guide more reliable forecasts than raw points alone.
Final thoughts on using metrics in the group stage
Metrics don’t remove drama from the group stage; they clarify where the drama comes from. By focusing on underlying chance creation and prevention, adjusting for small samples, and factoring in rotation and tie-breaker rules, you can turn noisy standings into informed probability statements. That’s what separates guesswork from reasoned expectation.
Read the numbers as a supplement to what you see on the pitch—never a replacement. Metrics point to likely paths and high-impact games; in tournaments, that edge can be the difference between being surprised and being prepared. The group stage rewards those who combine clear analytics with a feel for tactical nuance.
Sources and experts
- StatsBomb — Sam Gregory, Ted Knutson https://statsbomb.com
- FBref (StatsBomb event data) https://fbref.com
- Understat — Ted Knutson https://understat.com
- FiveThirtyEight — Nate Silver, Ben Morris https://fivethirtyeight.com
- Opta / Stats Perform https://optasports.com
- The Analyst (Stats Perform) https://theanalyst.com
- Michael Caley — blog and methods http://michaelcaley.org
- Chris Anderson & David Sally — The Numbers Game (book) https://www.penguinrandomhouse.com
Full analysis of the information in this article was conducted by experts from sports-analytics.pro